
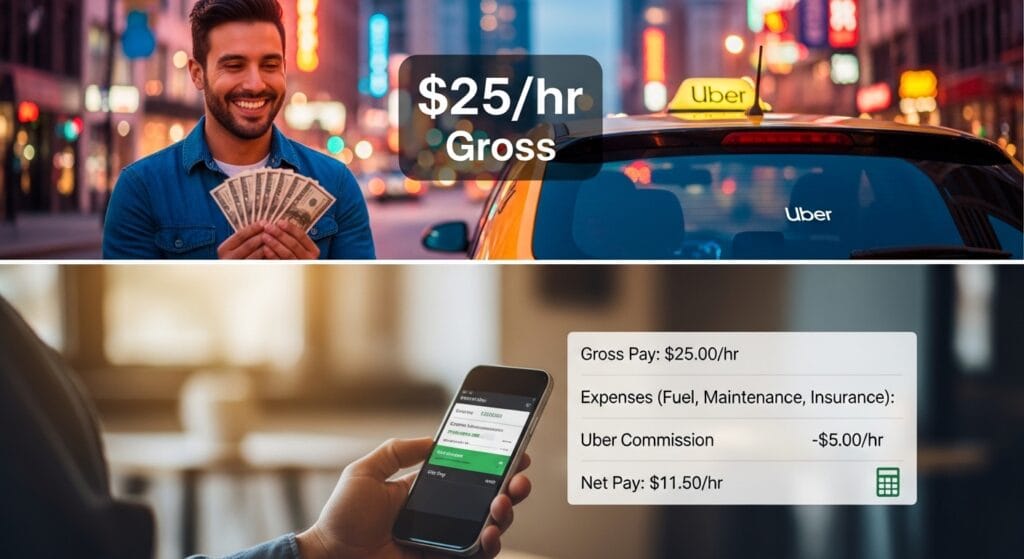
Uber Driver Pay 2026: $25/hr Gross — But What’s Net?
Quick Facts — Uber Driver pay 2026
| Data Point | Figure |
|---|---|
| Median Gross Hourly Pay | $19.00 – $25.00 |
| Median Net Hourly Pay (After Expenses) | $10.00 – $14.00 |
| Top 10% Gross Hourly (Uber Black/XL) | $30.00 – $50.00 |
| Entry Level Net Hourly | $5.00 – $8.00 |
| Best Market | New York City, NY ($35.86/hr net) |
| IRS Mileage Rate 2026 | $0.725/mile |
| BLS OES Code | 53-3058 (Rideshare Drivers) |
| Last Updated | February 2026 |
Is Uber Driving Worth It in 2026?
Here’s the direct answer to how much do Uber drivers make in 2026: gross earnings look impressive on the app dashboard, but after accounting for gas, depreciation, insurance, deadhead miles, and self-employment taxes, the true net take-home is 35–55% lower than what the platform displays. Your real Uber driver net income depends on your city, vehicle, driving strategy, and — most critically — whether your local government has stepped in to protect driver pay.
Table 1: Uber Driver Hourly Pay 2026 (Gross vs Net Profit)
| Driver Tier | Annual Gross | Gross Hourly | Net Hourly (After Expenses) |
|---|---|---|---|
| Low Earner (10th Percentile) | $27,511 | $16.00 | $5.00 – $8.00 |
| Median Full-Time (50th Percentile) | $40,502 | $19.00 – $25.00 | $10.00 – $14.00 |
| Top Earner (90th / Black / XL) | $57,505 – $72,499+ | $30.00 – $50.00 | $15.00 – $25.00 |
⚠️ Net figures apply the 2026 IRS Standard Mileage Rate of $0.725/mile (covering fuel, maintenance, insurance, and depreciation) plus a self-employment tax adjustment of 15.3% on net profit.
“Enter your gross weekly earnings and estimated mileage to see your true net profit:”
Paycheck Calculator
Calculate your Weekly, Monthly & Yearly Take-Home Pay
$✓ Rate automatically detected from page titleYearly Net Pay (Take Home) $0.00Monthly Pay $0.00Weekly Pay $0.00Gross Annual Income: $0.00Standard Deduction (2026): -$16,100.00Federal Tax (Est.): -$0.00State Tax (Est.): -$0.00FICA (7.65%): -$0.00⚠️ These are estimates for a single filer using 2026 tax rates (IRS Rev. Proc. 2025-32). Results do not include local taxes, pre-tax deductions (401k, health insurance), or tax credits. Consult a tax professional for personalized advice.
Rideshare Demand & Driver Statistics
The global ride-sharing market was valued at approximately $144.10 billion in 2025 and is projected to hit $170.32 billion in 2026, with a compound annual growth rate (CAGR) of 18.40% through 2034 — targeting a staggering $659 billion valuation. Consumer demand has never been stronger. Uber’s monthly active users now range from 180 to 200 million, a 15% year-over-year increase, and the platform processed over 11.27 billion trips in 2024 — roughly 40 million rides every single day.
So the customers are there. The corporate profits are undeniable. Uber generated $9.8 billion in net profit in 2024, up from $1.8 billion the year before. But here’s the paradox that every driver needs to understand: platform revenue growth has completely decoupled from driver compensation growth.
There are approximately 1.0 to 2.5 million active US rideshare drivers at any given time, with California alone counting 209,000 and New York City 80,000. When you add Lyft’s 2+ million active US and Canadian drivers to the mix, the domestic labor pool is intensely saturated — and oversupply is precisely the mechanism platforms use to suppress per-trip payouts algorithmically.
The autonomous vehicle threat adds another layer of pressure. In the five major metro areas where robotaxis currently operate, human drivers completed 5.3% fewer trips per hour in Q4 2025 compared to a year earlier. Driver utilization rates — the share of online time actually earning money — dropped 2.5% in those same AV-active cities. AVs aren’t replacing drivers overnight, but they are functioning as a permanent wage ceiling, expanding total market demand while slowly eroding the economics that make human driving viable.

Uber Driver Salary Breakdown
This is where the financial reality gets uncomfortable — and where most “how much do Uber drivers make” articles completely mislead you.
The Platform Take Rate: It’s Not 25% Anymore
Uber has historically advertised a 20–25% commission on fares. In 2026, that number is a marketing fiction. The real effective take rate — accounting for upfront pricing spreads, marketplace fees, and algorithmic manipulation — averages approximately 40%. On individual trips, documented case studies show the platform capturing 66% to 72% of what the passenger paid. In one widely-shared example, a passenger was charged $72.75 for a trip while the driver received only $24.82. That’s a 66% platform capture.
The mechanics behind this are deliberate. Uber’s “upfront pricing” algorithm calculates the maximum a rider will pay and the minimum a driver will accept, then pockets the widening spread. This structural shift transferred the majority of operational risk — traffic delays, sub-optimal routing, vehicle depreciation — directly onto the independent contractor.
The IRS Mileage Math That Changes Everything
The IRS sets the 2026 standard mileage rate at $0.725 per business mile. This isn’t an arbitrary bureaucratic number — it’s a comprehensive accounting of what it actually costs to operate a vehicle: fuel, routine maintenance, tire replacement, commercial insurance, and vehicle depreciation.
Here’s where it gets brutal. Consider a documented trip: 45.7 miles driven for a gross payout of $24.18. Multiply 45.7 miles × $0.725 and your vehicle operating cost is $33.13. The driver didn’t earn $24.18 — they effectively lost $8.95 on that trip while the app showed a “completed fare.”
Depreciation is the silent wealth extractor. When drivers celebrate their gross weekly earnings without subtracting depreciation, they are liquidating their vehicle’s physical equity and calling it a salary.
For comparison purposes, consider this: a full-time driver in Las Vegas working 40 hours a week generates $880–$1,400 in gross weekly revenue. After applying proper per-mile cost deductions, their realistic net profit settles between $640–$960 per week — only if no major mechanical failures occur. One blown transmission can erase months of net profit overnight.
For more context on how Uber’s pay structure stacks up against the competition, see Lyft Driver Salary .
Uber Driver Salary by City
Location isn’t just a factor — it’s the single biggest predictor of whether rideshare driver pay is worth your time. Here’s why: cities with regulatory intervention (TLC rules, app-based worker ordinances) cap driver supply and establish pay floors. Unregulated markets allow unlimited driver oversaturation, which destroys per-trip earnings.
| City / Market | Average Net Hourly Pay | Regulatory Edge |
|---|---|---|
| New York City, NY | $35.86 | TLC pay floors + supply caps |
| Chicago, IL | $23.01 | Dense urban demand, convention traffic |
| Seattle, WA | $22.00 – $24.00 | App-Based Worker Minimum Payment Ordinance |
| Portland, OR | $21.82 | Optimized supply-demand balance |
| Philadelphia, PA | $21.29 | High-density short-trip volume |
Why NYC dominates: The Taxi and Limousine Commission forces a minimum pay structure. A full-time NYC driver grosses roughly $72,839 annually. After approximately $19,966 in vehicle expenses ($0.616/mile), net annual pay reaches $52,900 — or $35.86 per hour. That’s a livable income. That’s the power of regulatory protection.
The California Warning: Despite the illusion of high gross demand in Los Angeles and San Francisco, academic studies of drivers under Proposition 22 reveal a devastatingly different picture. When calculating the “employee-equivalent wage” — factoring in no health insurance, no PTO, no workers’ comp, and self-employment taxes — median passenger drivers in California net approximately $5.97 per hour without tips. Even with tips, the figure reaches only $7.63. That is below the state minimum wage.
Airport runs and downtown surges are your most important optimization tools regardless of city. A $25 airport trip covering 12 miles in 25 minutes generates far better net economics than a $28 suburban highway run covering 35 miles in 45 minutes. Always prioritize trips with favorable distance-to-payout ratios. Veteran drivers set a minimum mental threshold of $1.50 to $2.00 per active mile before accepting an offer.
The True Cost of Rideshare Driving
The gig economy is engineered to externalize costs onto workers. Here are the hidden expenses that blindside new drivers — and why the Uber driver salary 2026 reality is far more complex than the app implies.
Vehicle Depreciation is the most significant hidden cost. Adding 40,000–60,000 miles per year to a vehicle doesn’t just wear it down mechanically — it obliterates resale value. Drivers who spend three years chasing gross earnings often find themselves holding a car worth $8,000 that cost them $22,000 when they started. They didn’t earn a salary; they liquidated an asset.
Rideshare Insurance is non-negotiable and expensive. Standard personal auto insurance does not cover commercial driving. State-mandated uninsured/underinsured motorist coverage requirements for rideshare work can be exorbitant — California, for example, mandates up to $1 million in coverage limits, forcing commercial-grade premium costs onto individual contractors. These premiums eat directly into net income.
Deadhead Miles are the industry’s dirtiest secret. The platform pays for active passenger miles only. Every mile driven to pick up a passenger, every repositioning drive toward a surge zone, every return trip from a remote suburban drop-off — all of these cost you $0.725 per mile while generating $0.00 in revenue.
Self-Employment Taxes catch every new 1099 driver off-guard. Unlike W-2 employees whose employers cover half of FICA taxes, rideshare drivers pay the full 15.3% Self-Employment Contributions Act (SECA) tax on net earnings — plus federal and state income taxes on top. The true W-2 equivalent of an $11.77 gross hourly rate, once you deduct self-employment taxes and the absence of employer-sponsored benefits, collapses to approximately $9.21 per hour.
Quarterly estimated taxes are also mandatory for full-time drivers to avoid IRS penalties. This creates an administrative accounting burden that many drivers underestimate when entering the gig.
For a broader look at how these gig economy dynamics play out in delivery work, see Delivery Driver Salaries.
FAQ
How much do Uber drivers make a week after expenses?
Part-time drivers (10–20 hours/week) gross $200–$500 but typically net $120–$300 after proper mileage deductions. Full-time drivers in mid-tier markets can net $700–$900 per week under ideal conditions — no accidents, a fuel-efficient vehicle, and strategic trip selection.
Is Uber driving a good full-time job in 2026?
Only in regulated markets like NYC and Seattle. Nationally, the absence of health insurance, PTO, and workers’ comp means the gross hourly pay must be discounted by at least 21.75% to find a true W-2 equivalent wage. In unregulated markets, full-time driving is economically precarious and should be treated as supplemental income deployed during peak surge windows only.
How much does Uber take from drivers?
Historically advertised as 20–25%, the real effective take rate in 2026 averages 40%, with documented individual trips showing platform capture as high as 66–72%.
Do Uber drivers pay their own taxes?
Yes, entirely. Drivers are 1099 independent contractors who owe the full 15.3% SECA tax on net earnings, plus federal and state income tax. Quarterly estimated payments to the IRS are required for most full-time operators. The 2026 IRS mileage deduction of $0.725/mile is the most powerful tool available to reduce taxable net profit.
What are the best cities for Uber drivers?
New York City, Chicago, Seattle, Portland, and Philadelphia — in that order — based on net hourly earnings after expenses. Each combines regulatory protection or strong demand density with manageable per-mile operating costs.
How much do Uber drivers make per mile?
Gross base rates typically range from $0.60–$0.82 per mile. But the IRS costs $0.725/mile to operate a vehicle. On long suburban or highway trips, many drivers earn less per mile than it costs to drive — making these trips net-negative. The optimized net profit per active mile for a disciplined driver compresses to roughly $0.10–$0.35.
What are the biggest hidden costs of driving for Uber?
Vehicle depreciation (silent equity destruction), commercial/rideshare insurance (can exceed $200–$400/month in high-mandate states), deadhead miles (zero revenue, full vehicle cost), and accident liability exposure (no workers’ comp, high deductibles, lost income during vehicle downtime).
Final Verdict: Is Uber Driving Worth It in 2026?
The honest answer is: it depends entirely on where you drive and how you run the numbers.
The platform is profitable — extraordinarily so. Consumer demand is real, growing, and sustainable. But Uber driver net income has been systematically compressed by algorithmic upfront pricing, workforce oversaturation, and AV market creep. The era of effortless gig economy profits is over.
If you’re in New York, Chicago, or Seattle — where local government has mandated livable pay floors — full-time rideshare driving remains a mathematically viable career generating $23–$36 net per hour. If you’re in an unregulated or Prop 22-governed market, treat this strictly as a tactical side income stream deployed only during peak surge windows. Never chase high-mileage offers. Never ignore your per-mile operating cost. And never mistake gross app earnings for actual take-home pay.
The drivers who profit in 2026 run this like a small business: they track every mile, decline unprofitable trips, and understand that their vehicle is a depreciating commercial asset — not a free tool.
If you’re exploring alternatives to maximize your gig earnings, check out DoorDash Dasher Pay for a direct comparison of delivery-based gig income.
Sources: BLS OES 53-3058 | IRS 2026 Standard Mileage Rate ($0.725/mile) | HR&A Advisors Rideshare Net Earnings Study 2025 | UC Berkeley Labor Center Gig Driver Pay Analysis | Gridwise Analytics 2026 AV Impact Report | Fortune Business Insights Ride-Sharing Market Report 2026
“If you are looking for Delivery Driver jobs, check out our guides on [Owner Operator] and [Amazon Flex ].”